
App Tamer 2.0.5 just dropped, fixing a compatibility glitch with Safari that could cause App Tamer to mis-manage full-screen Flash playback (among other things). There are also a host of smaller fixes that will improve your user experience, like better error messages, fixing permissions problems automatically, etc.
This version also explicitly offers to switch to a logarithmic cpu graph on 8- and 16-core Macs to increase the amount of detail you can typically see on the graph (science and tech nerds nod here, while everyone else says “what the heck is a logarithmic cpu graph?”).
What’s logarithmic graph good for?
Basically, it changes the vertical scale of the graph so that data toward the bottom of the graph is magnified, while the top of the graph is squeezed together. Since most of the activity on the cpu graph is down below 50% on 8- and 16-core Macs (because you’re rarely actually using all 8 or 16 cores), this lets you see more details that you care about.
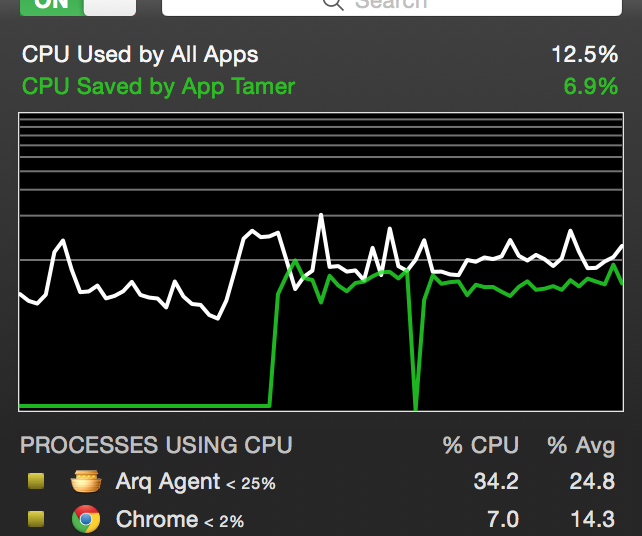 In the screenshot of App Tamer’s logarithmic cpu graph to the right, each horizontal gray line on the graph represents a 10% increment. As you can see, the bottom 10% increment takes up half of the vertical space, the next 10% takes up 15% of the space, and so on, with each successive 10% increment taking a smaller amount of screen real estate. This magnifies the bottom end of the graph, where most of the activity happens on Macs with lots of cpu power.
You can toggle between a regular linear graph and the logarithmic one by control-clicking (or right-clicking) on the graph. A little popup menu lets you choose which scale you want to use.
Back to your regularly scheduled program…
Sorry for the digression. You can see the full change history and download App Tamer 2.0.5 on the App Tamer Release Page.